Project report title: Project Ten: The Arizona Trail
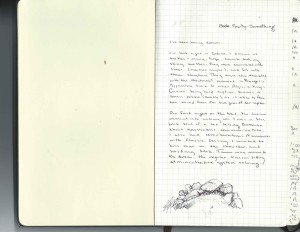
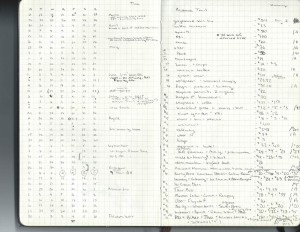
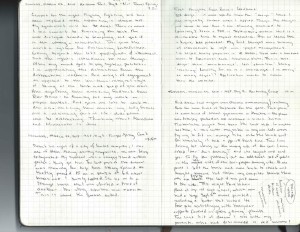
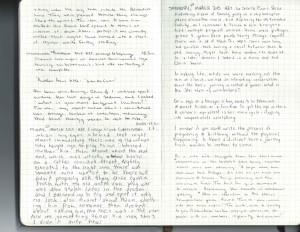
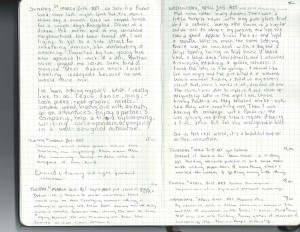
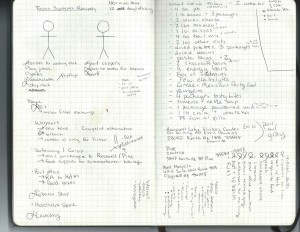
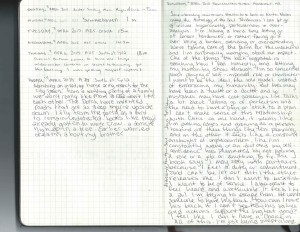
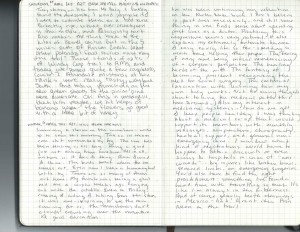
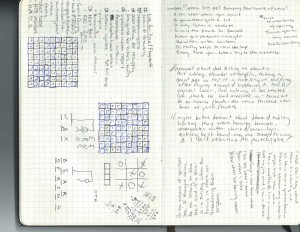
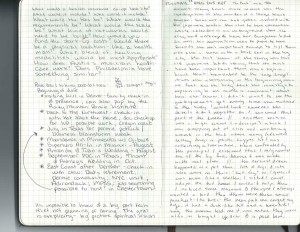
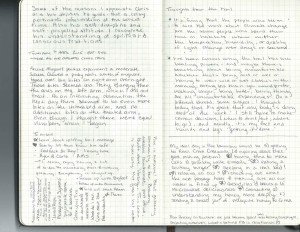
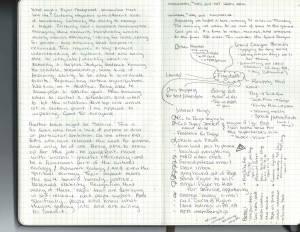
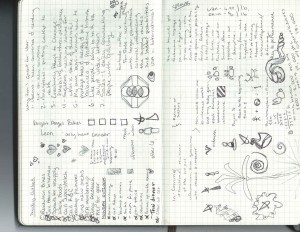
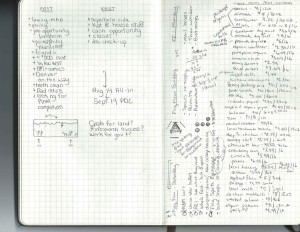
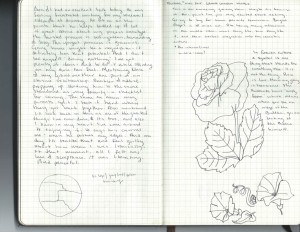
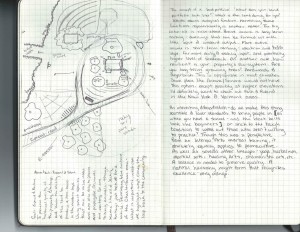
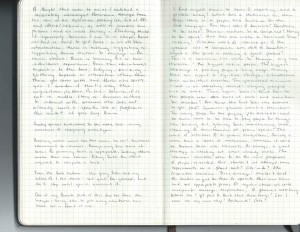
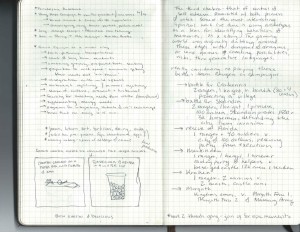
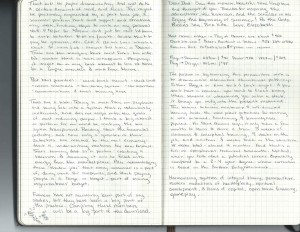
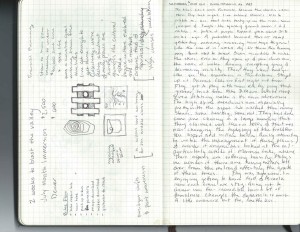
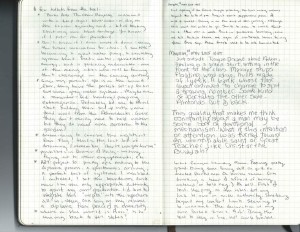
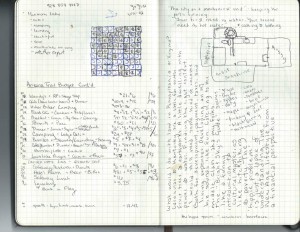
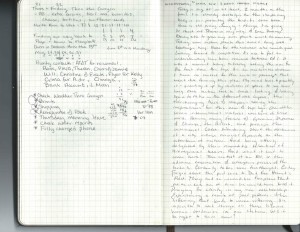
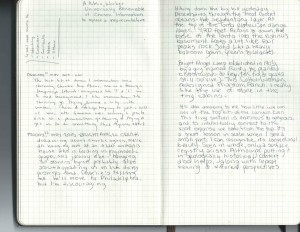
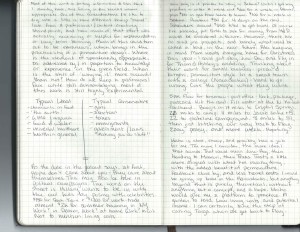
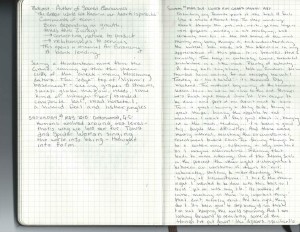
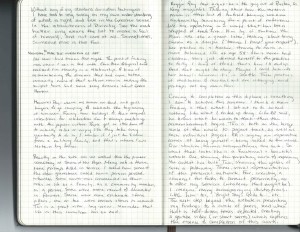
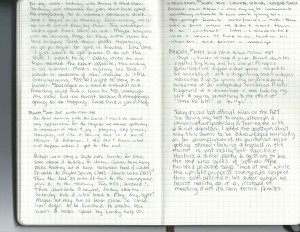
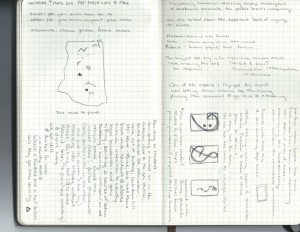
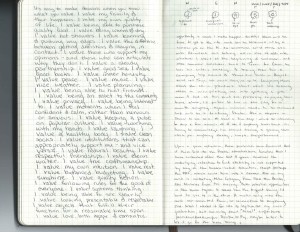
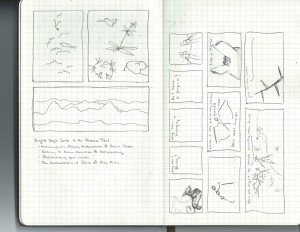
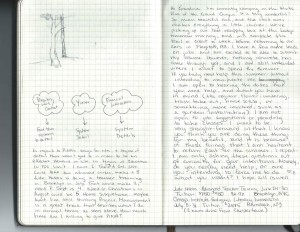
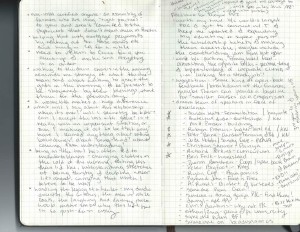
Summarize how and why you organized this Project Output as presented (Reflect on your design, process, method and purpose): This project output is probably my favorite of all the projects. One of the reasons I like it is that I get to include a full spectrum from my journals. These really are the core of my practice, the skill of 10,000 hours, and usually I just include bits and pieces from whiteboards, etc, but for this output report I chose to include every page from the entire time we were actually on the trail. This was paired with the complete photo album. The second half of the project report is the information I actually sent to the Arizona Trail Association in their request for information on the trail conditions.
How did this process go? It was thankfully easy. The documents for the ATA were on google and just needed importing. Lucky, because they were probably the last documents I created on my computer before it volunteered for a permanently secret mission to an unknown part of the world. Scanning the journal notes took about two hours, and an additional two hours to get them to the right orientation and file type. Saving the pictures from the harddrive, onto Flickr was also a process with many steps.
What did you learn? I learn that I do a lot of work and then often forget about it. The work of disseminating the information is often equal to the amount of work it took to assemble the information, is often equal to the amount of work it took to do the project in the first place.
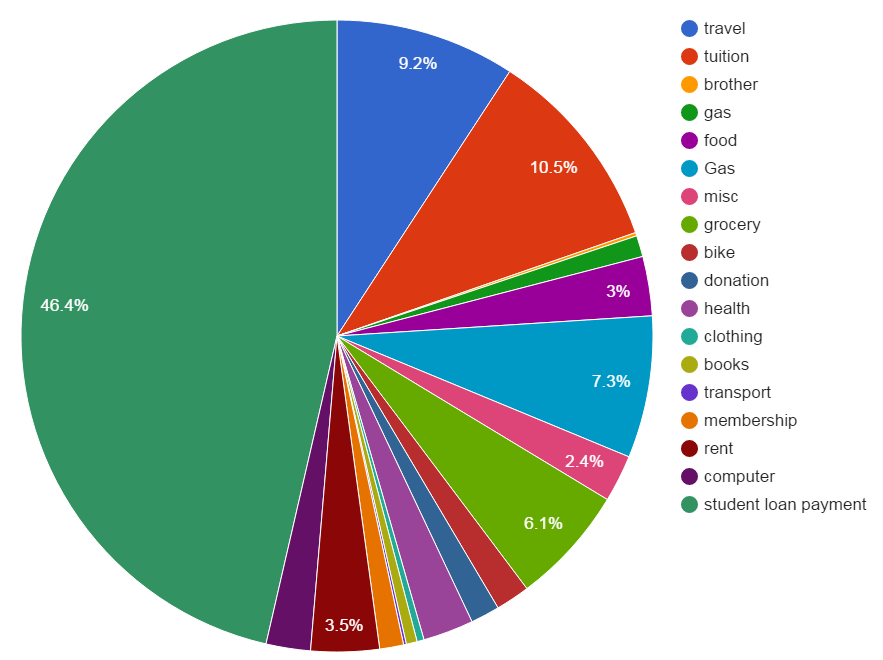
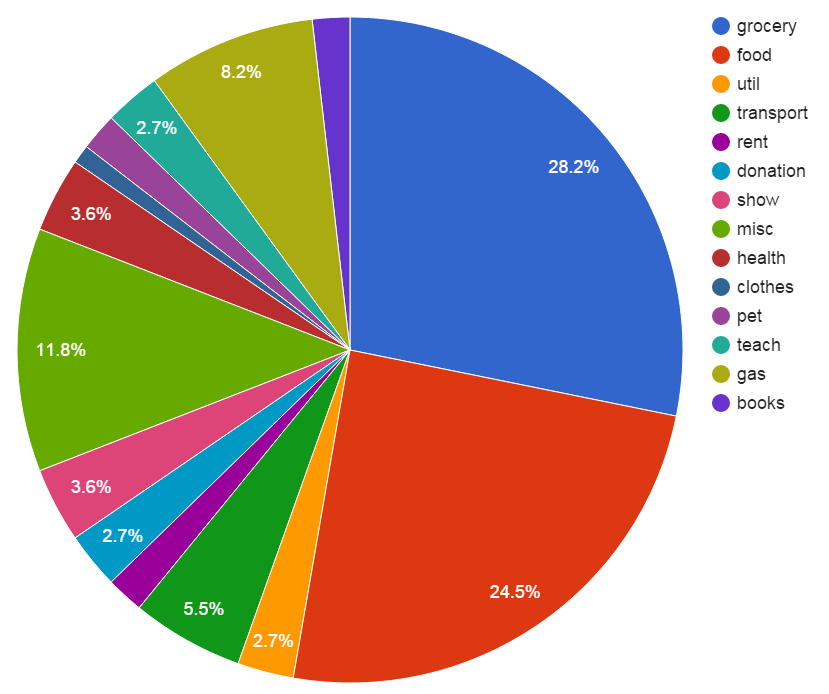
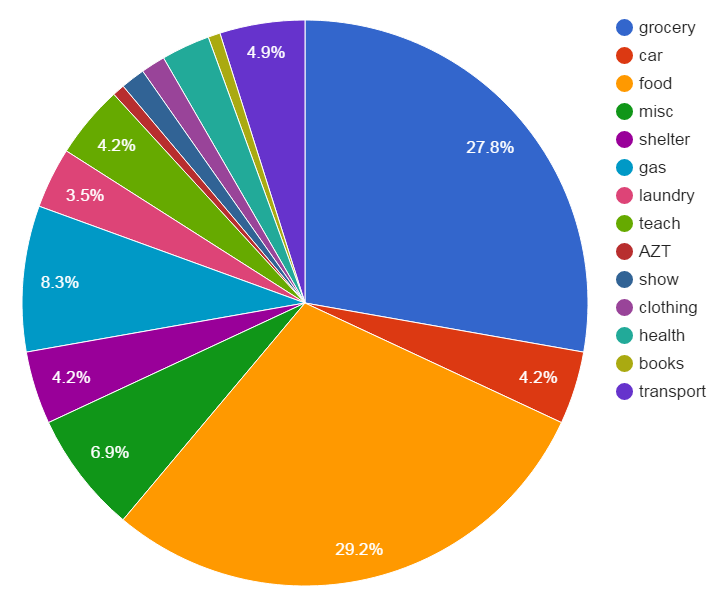
What tools did you use (An explanation of the technical side of creating this project report. What software did you use? What digital literacy was required to put this together)? I used a scanner for the journal notes, and Flickr for the photo album. I used VUE for one of the mind maps, Pages for the financial analysis and miles per day. I uploaded them through WordPress, and wha-la!
Did you find any people or tutorials particularly useful in creating this project report? I looked at Theron’s work to be inspired by the VUE, and followed basic tutorials for the accounting bit.
How much time did you spend in creating this project report? The project report for the AZT took about 10 hours, scanning, uploading, and transferring files an additional 10. Around 20 hours total.
How well have did you showcase your learnings in this project report? Would you consider this project report satisfactory if it was prepared by another person? The learnings here are the experiential capital of finding & carrying my own water, navigating through unknown terrain, and observing nature. I would say this is a great showcase for the experience.
Any final reflections on your pathway integration and development? I’m so glad this came up as it did. Project Ten was an incredible journey, and was such an essential piece of learning. Going directly to the beauty and rhythms of our natural world is a more complete education that anything you can learn on YouTube University.
